Logística Simples

Free resources · Logística Simples

Supply chain in eight visual guides

Concepts for understanding supply chains and improving decisions, with fictional examples. Read the translated text below each visual; images and downloads remain in Portuguese.

Download PDF collection · 8 pages · PortugueseDownload images and PDFs · ZIP · Portuguese

Original introductory content on the eight general topics in the public CSCP module 1–8 structure. It does not reproduce teaching materials, cover the entire programme or replace the course or official preparation. Independent material, with no ASCM/APICS affiliation, sponsorship or endorsement. CSCP is an ASCM/APICS certification.

Module 1 topic · Demand

Demand that guides decisions

Connect market signals to fulfilment capacity.

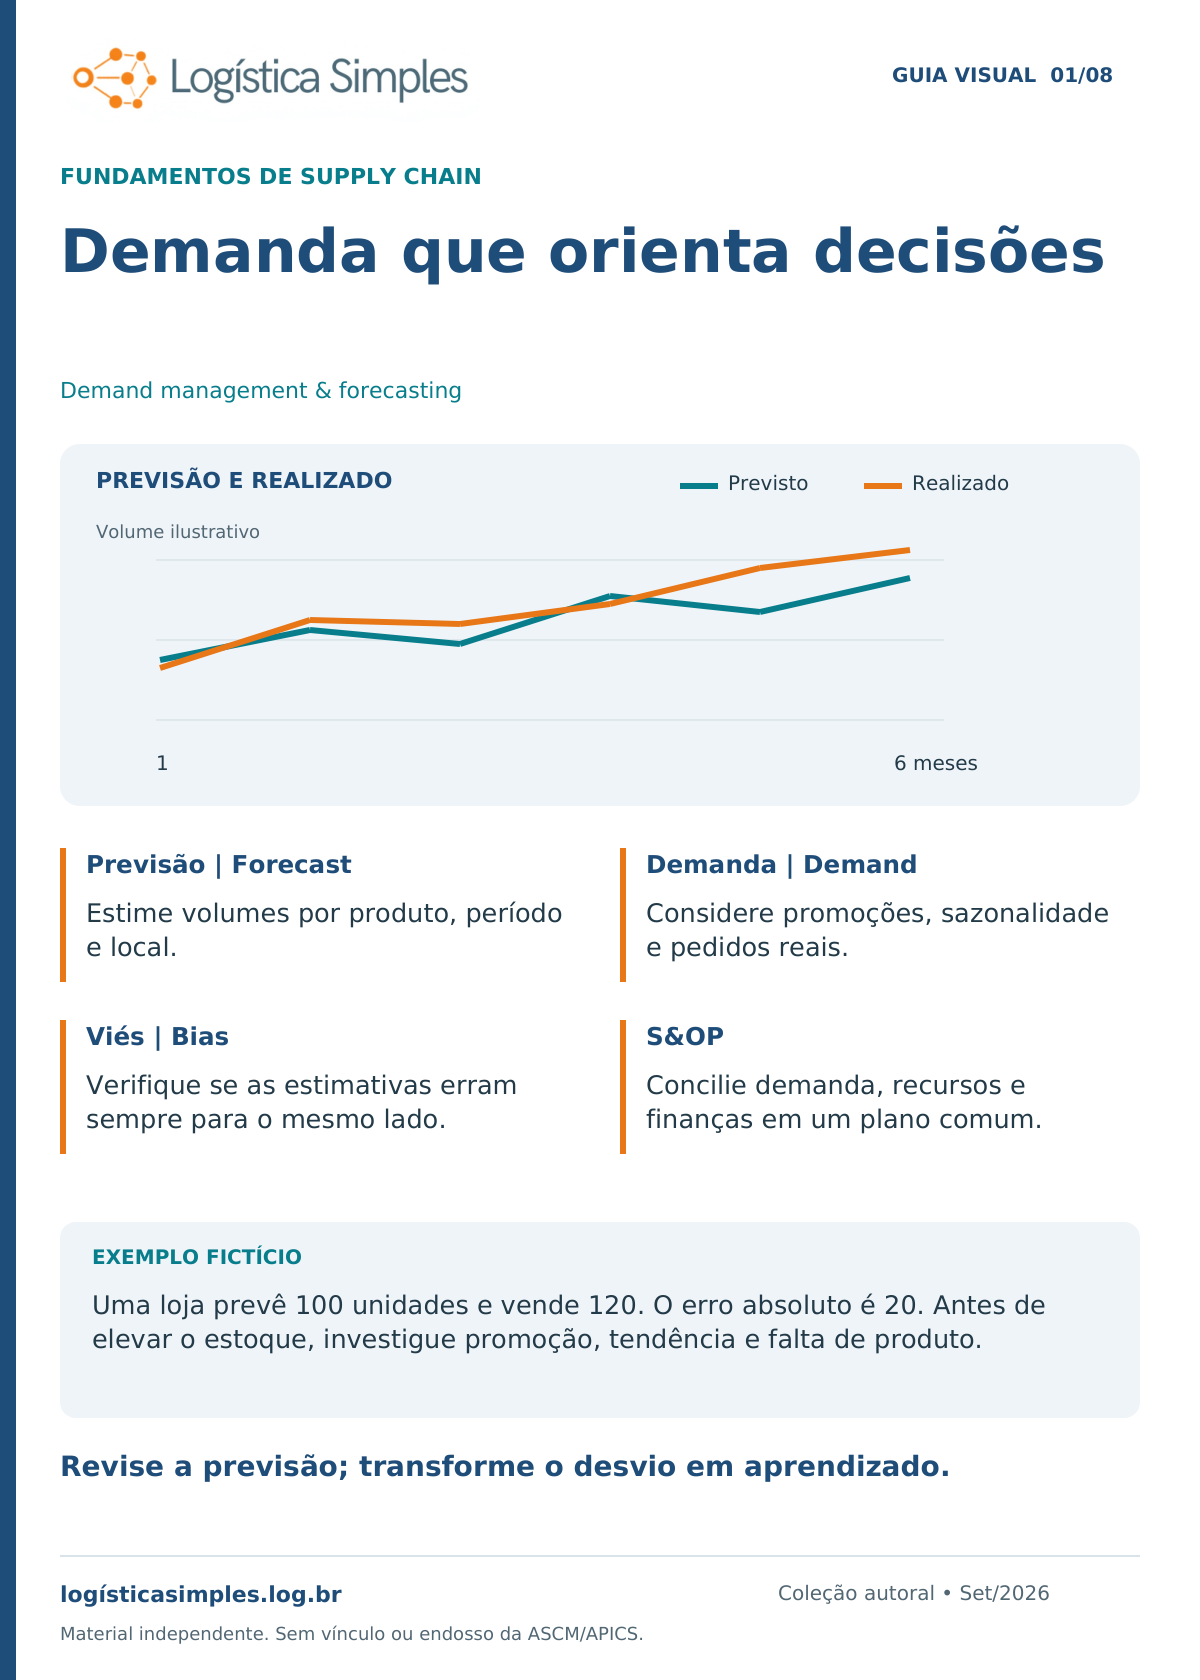
Infographic 1: Demand that guides decisions. Diagram, four concepts and a fictional example. Full translated text below.
Read the text version

Demand management & forecasting

Forecast
Estimate volumes by product, period and location.
Demand
Consider promotions, seasonality and actual orders.
Bias
Check whether forecasts consistently err in the same direction.
S&OP
Align demand, resources and finance in a shared plan.

Fictional example: A store forecasts 100 units and sells 120. Absolute error is 20. Before increasing stock, investigate promotions, trends and product shortages.

Review the forecast; turn deviations into learning.

Module 2 topic · Networks

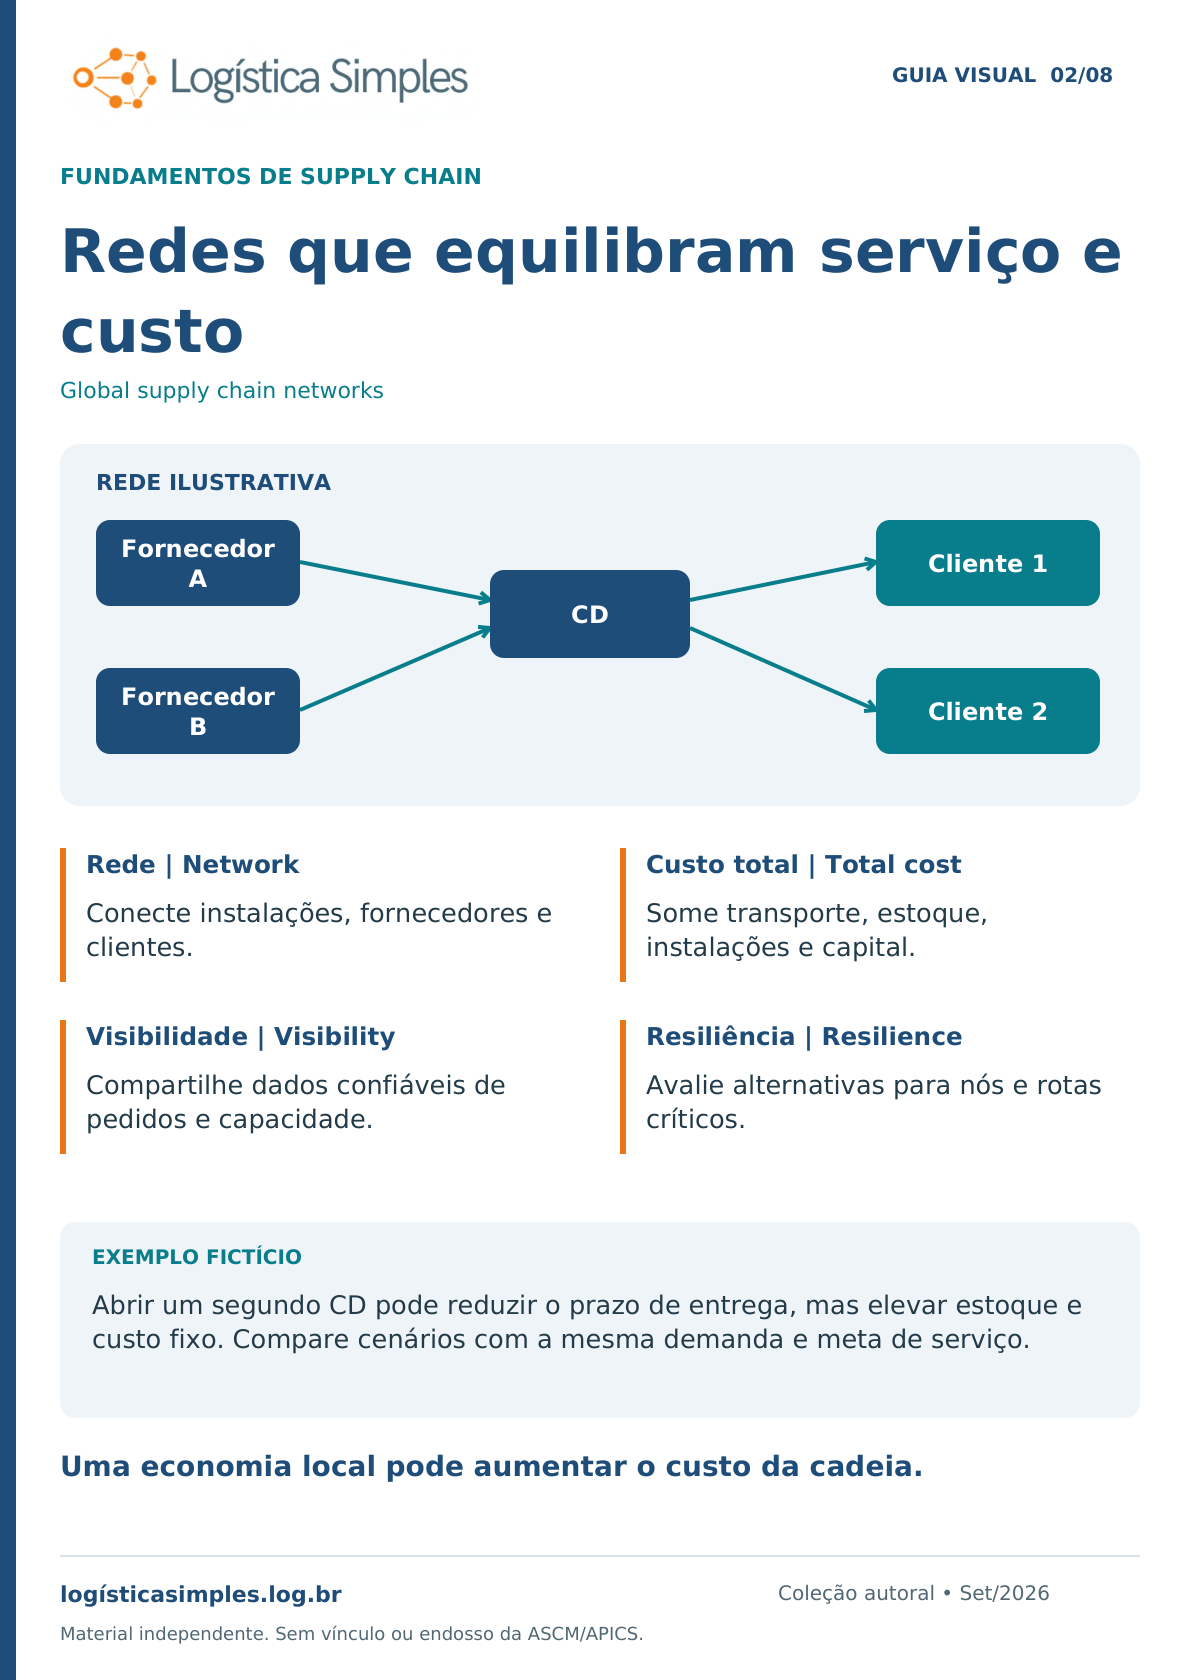
Networks balancing service and cost

Choose where to buy, produce, store and deliver.

Infographic 2: Networks balancing service and cost. Diagram, four concepts and a fictional example. Full translated text below.
Read the text version

Global supply chain networks

Network
Connect facilities, suppliers and customers.
Total cost
Add transport, inventory, facilities and capital costs.
Visibility
Share reliable order and capacity data.
Resilience
Assess alternatives for critical nodes and routes.

Fictional example: A second distribution centre may shorten delivery times but increase stock and fixed costs. Compare scenarios with the same demand and service target.

A local saving can increase supply chain cost.

Module 3 topic · Procurement

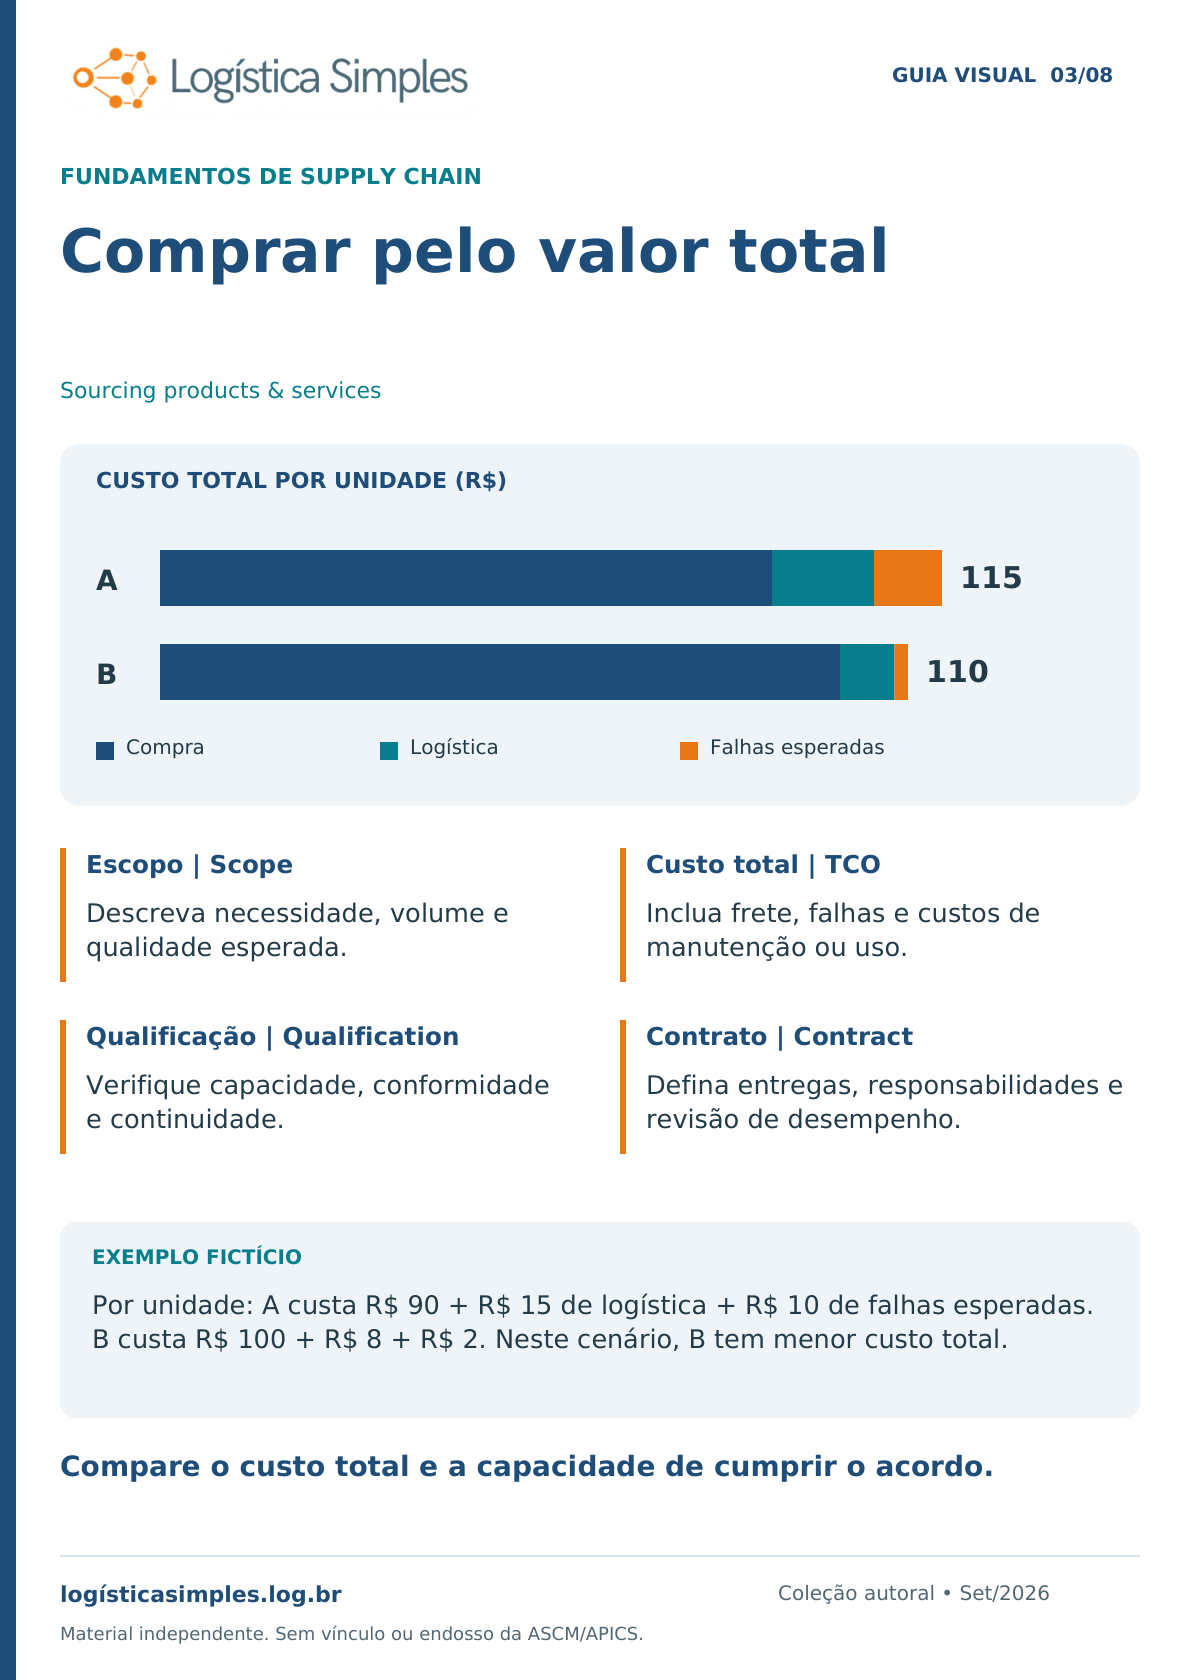
Buy for total value

Price is one part of supplier selection.

Infographic 3: Buy for total value. Diagram, four concepts and a fictional example. Full translated text below.
Read the text version

Sourcing products & services

Scope
Describe the need, volume and expected quality.
Total cost of ownership (TCO)
Include freight, failures and maintenance or usage costs.
Qualification
Check capacity, compliance and continuity.
Contract
Define deliverables, responsibilities and performance reviews.

Fictional example: Per unit: A costs R$90 + R$15 logistics + R$10 expected failures. B costs R$100 + R$8 + R$2. In this scenario, B has the lower total cost. Values are in Brazilian reais.

Compare total cost and the ability to honour the agreement.

Module 4 topic · Operations and inventory

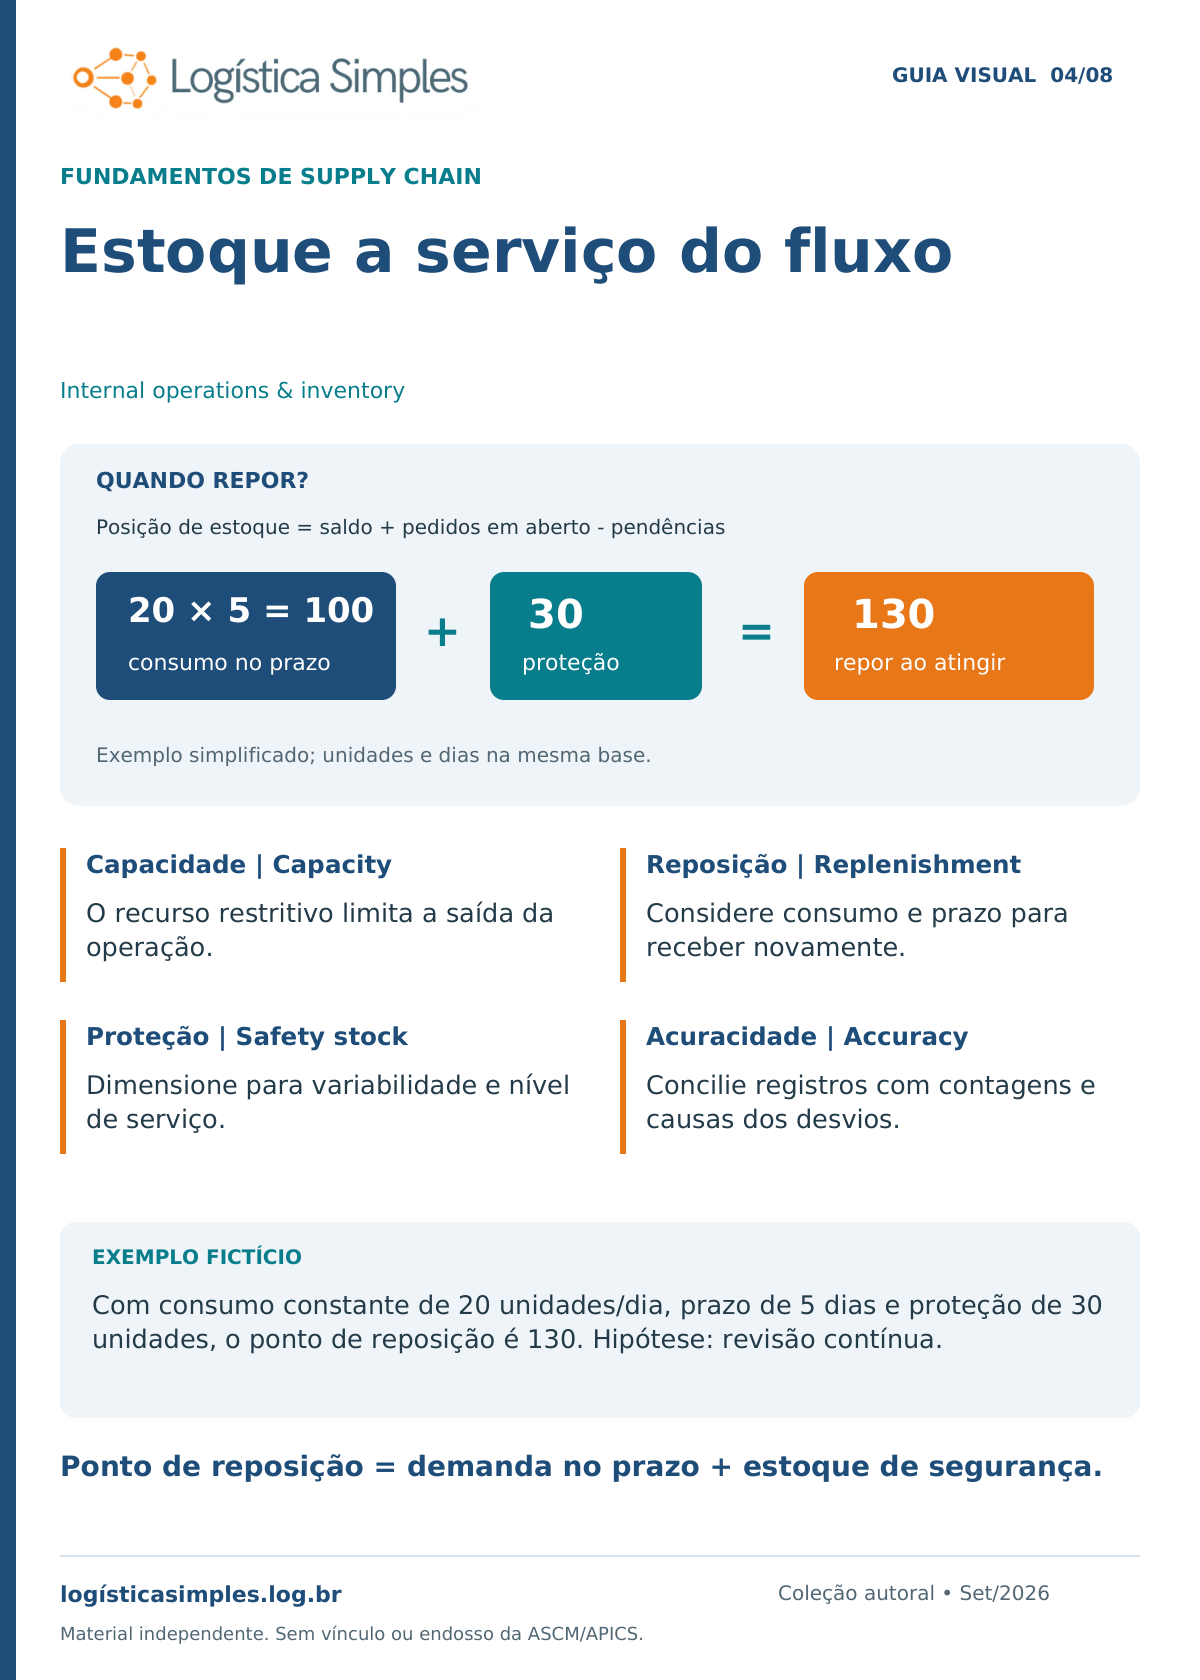
Inventory supporting flow

Protect service without hiding bottlenecks.

Infographic 4: Inventory supporting flow. Diagram, four concepts and a fictional example. Full translated text below.
Read the text version

Internal operations & inventory

Capacity
The constrained resource limits operational output.
Replenishment
Consider consumption and the lead time to receive again.
Safety stock
Size protection for variability and service levels.
Accuracy
Reconcile records with counts and investigate deviations.

Fictional example: At a constant 20 units/day, a 5-day lead time and 30 units of safety stock, the reorder point is 130. Assumption: continuous review.

Reorder point = demand during lead time + safety stock.

Module 5 topic · Logistics and returns

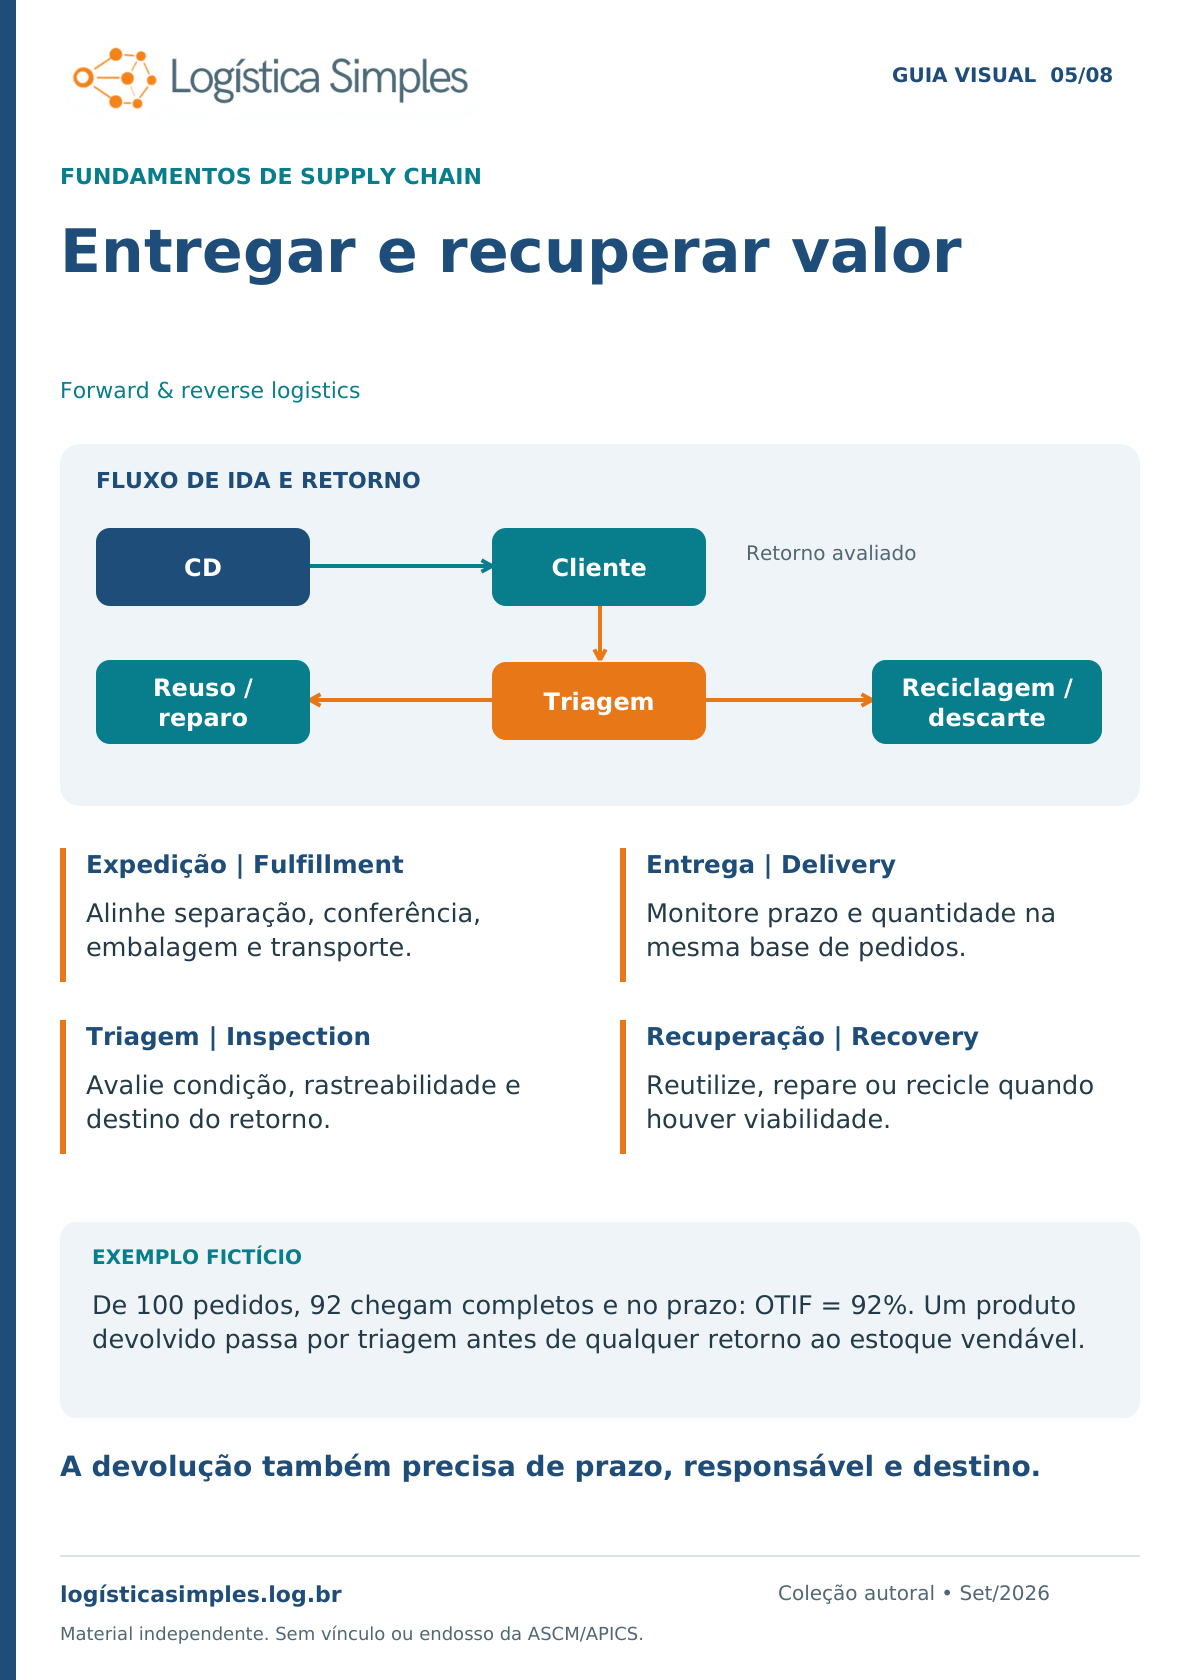
Deliver and recover value

Plan delivery to the customer and the destination of returns.

Infographic 5: Deliver and recover value. Diagram, four concepts and a fictional example. Full translated text below.
Read the text version

Forward & reverse logistics

Fulfilment
Align picking, checking, packaging and transport.
Delivery
Monitor timeliness and quantity on the same order base.
Inspection
Assess return condition, traceability and destination.
Recovery
Reuse, repair or recycle where feasible.

Fictional example: Of 100 orders, 92 arrive in full and on time: OTIF = 92%. A returned product is inspected before any return to saleable stock.

Returns also need a deadline, owner and destination.

Module 6 topic · Relationships

Partnerships with clear rules

Cooperation works with verifiable commitments.

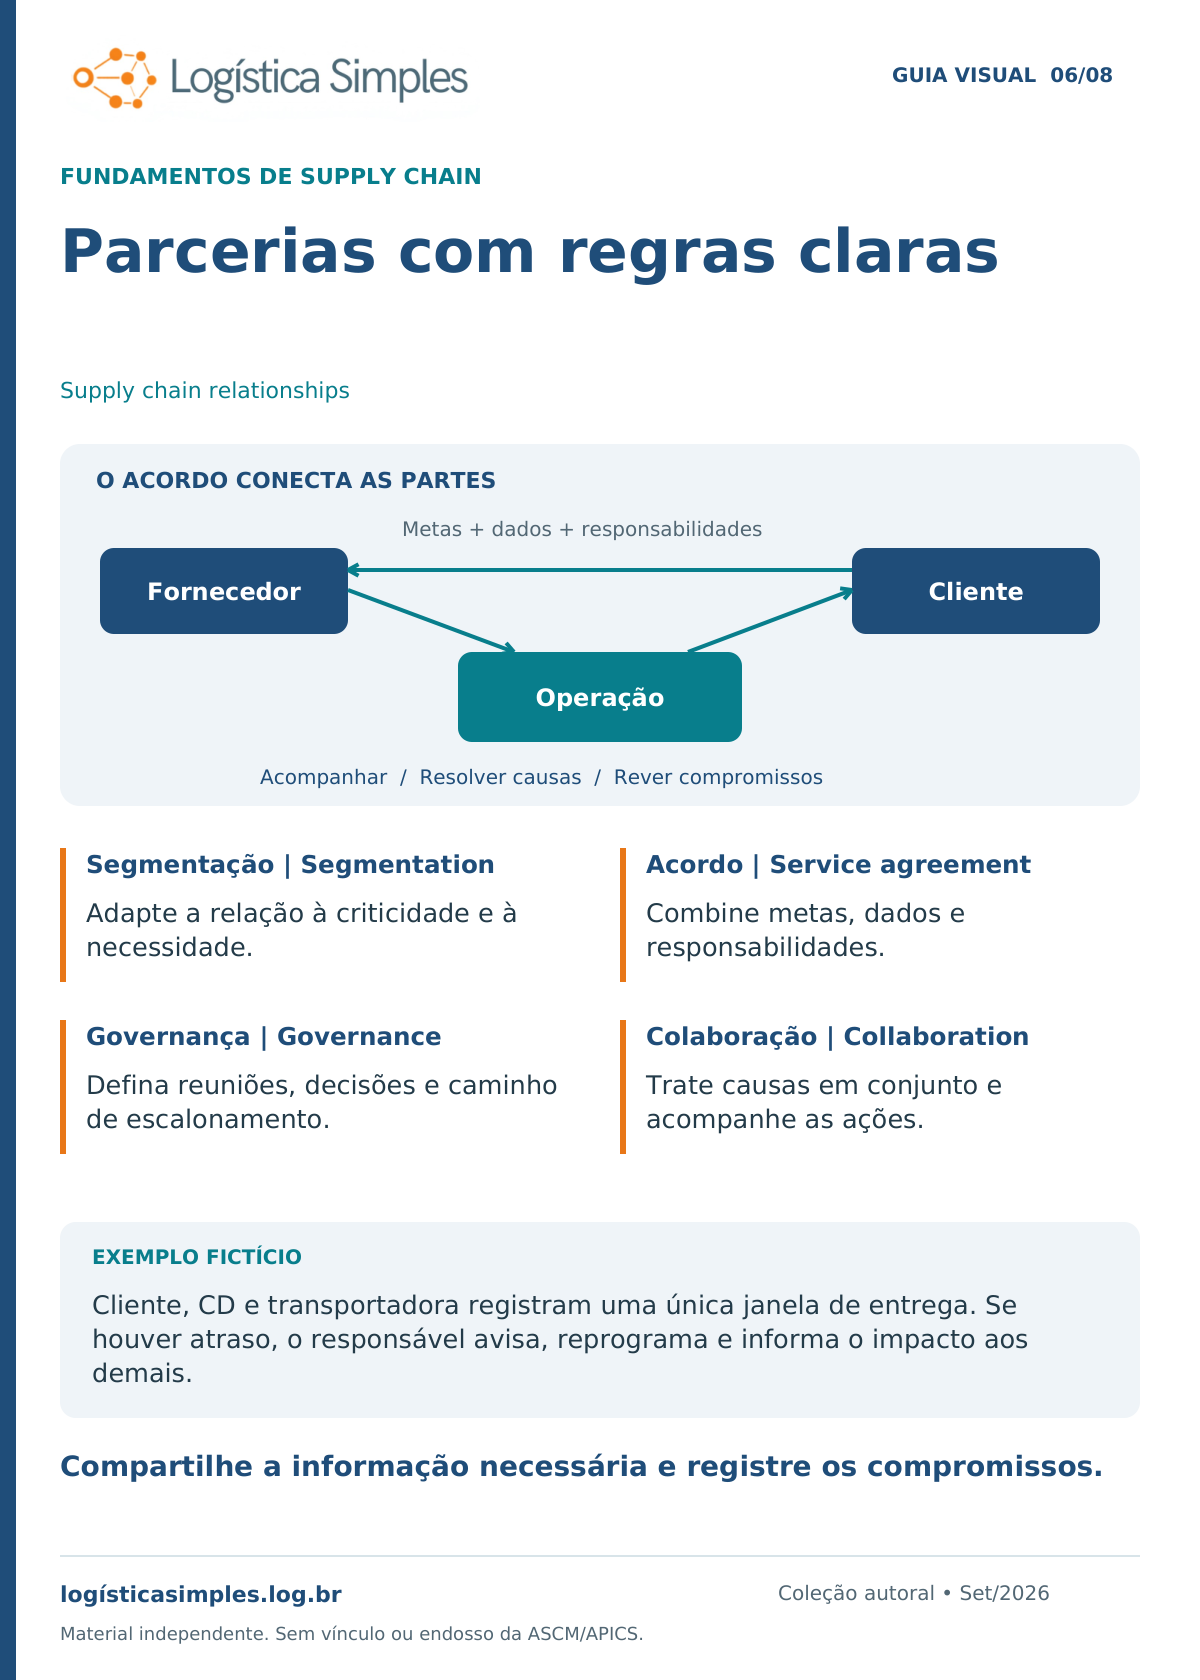
Infographic 6: Partnerships with clear rules. Diagram, four concepts and a fictional example. Full translated text below.
Read the text version

Supply chain relationships

Segmentation
Adapt relationships to criticality and need.
Service agreement
Agree on targets, data and responsibilities.
Governance
Define meetings, decisions and an escalation path.
Collaboration
Address causes together and track actions.

Fictional example: Customer, distribution centre and carrier record one delivery window. If delayed, the responsible person alerts others, reschedules and explains the impact.

Share necessary information and record commitments.

Module 7 topic · Risk

Prepared for risk, better at responding

Prioritise threats and prepare operational continuity.

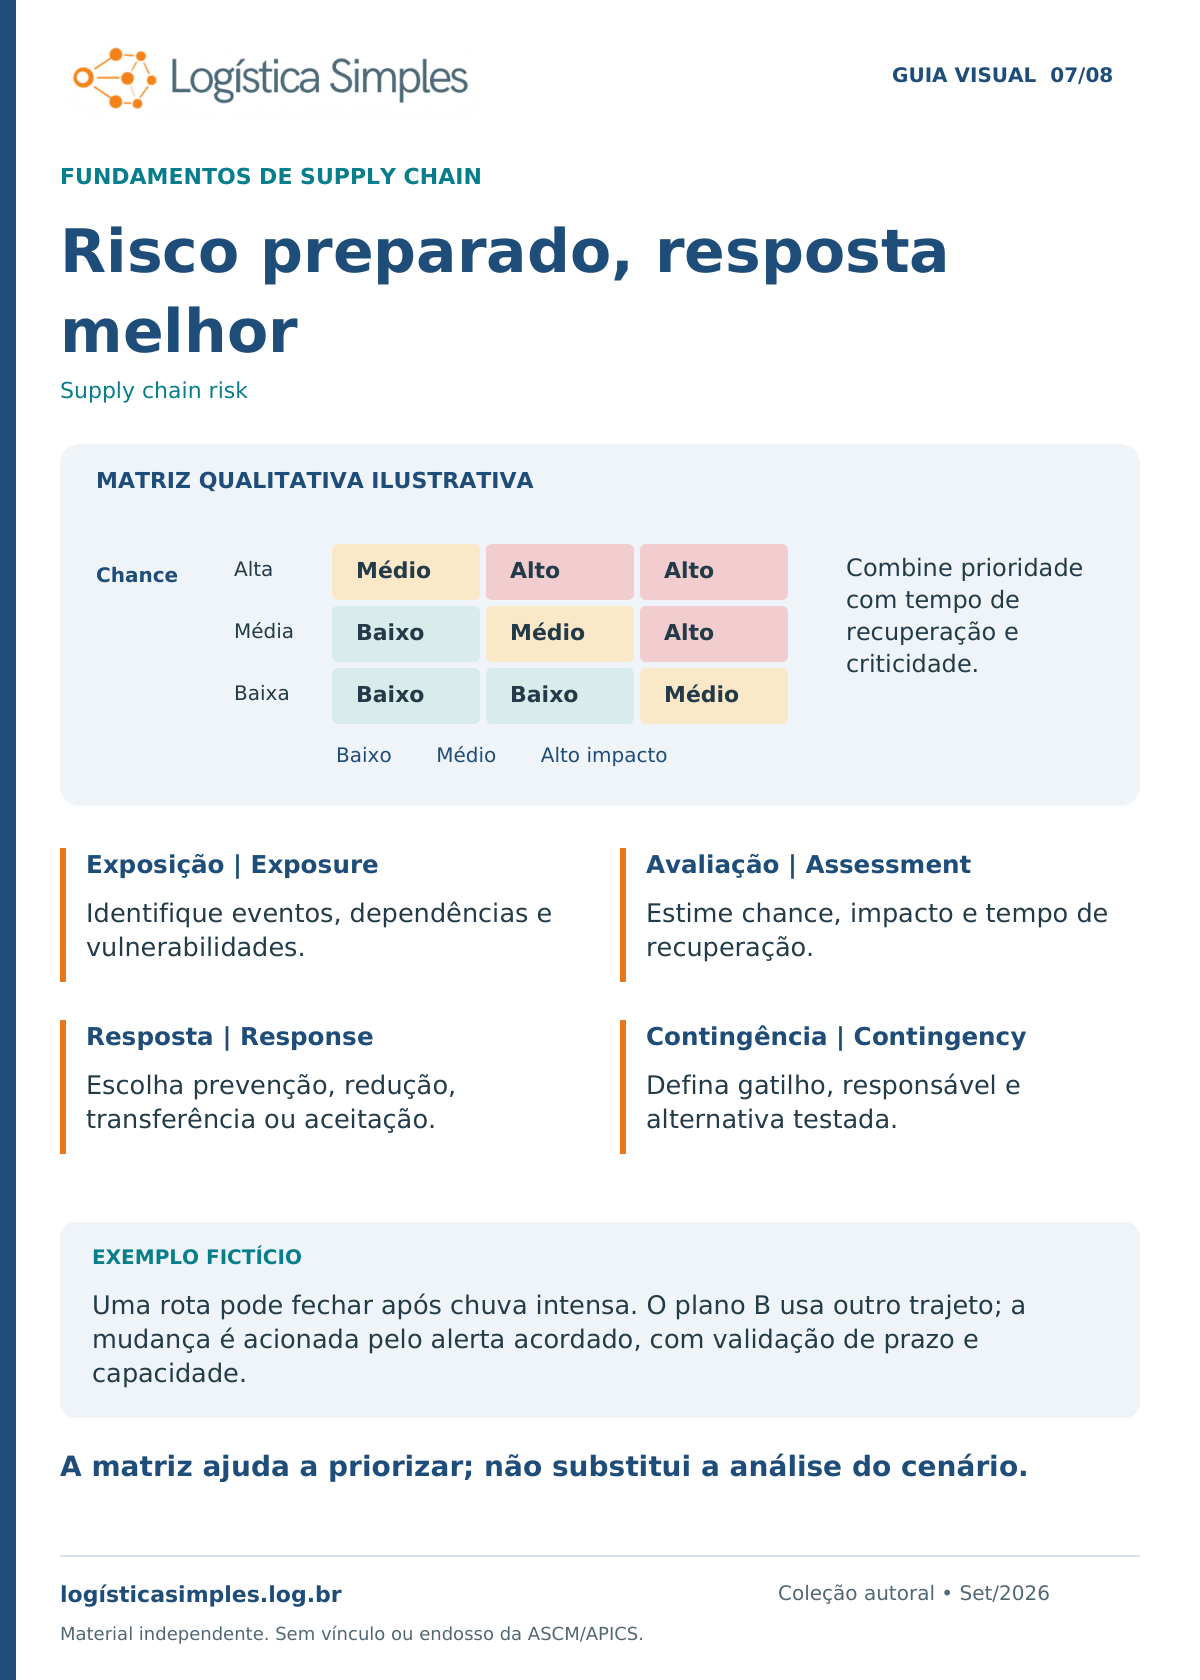
Infographic 7: Prepared for risk, better at responding. Diagram, four concepts and a fictional example. Full translated text below.
Read the text version

Supply chain risk

Exposure
Identify events, dependencies and vulnerabilities.
Assessment
Estimate likelihood, impact and recovery time.
Response
Choose prevention, reduction, transfer or acceptance.
Contingency
Define a trigger, owner and tested alternative.

Fictional example: Heavy rain may close a route. Plan B uses another route, activated by an agreed alert after validating lead time and capacity.

A matrix helps prioritise; it does not replace scenario analysis.

Module 8 topic · Sustainable improvement

Improve with data and purpose

Integrate performance, environmental impact and technology.

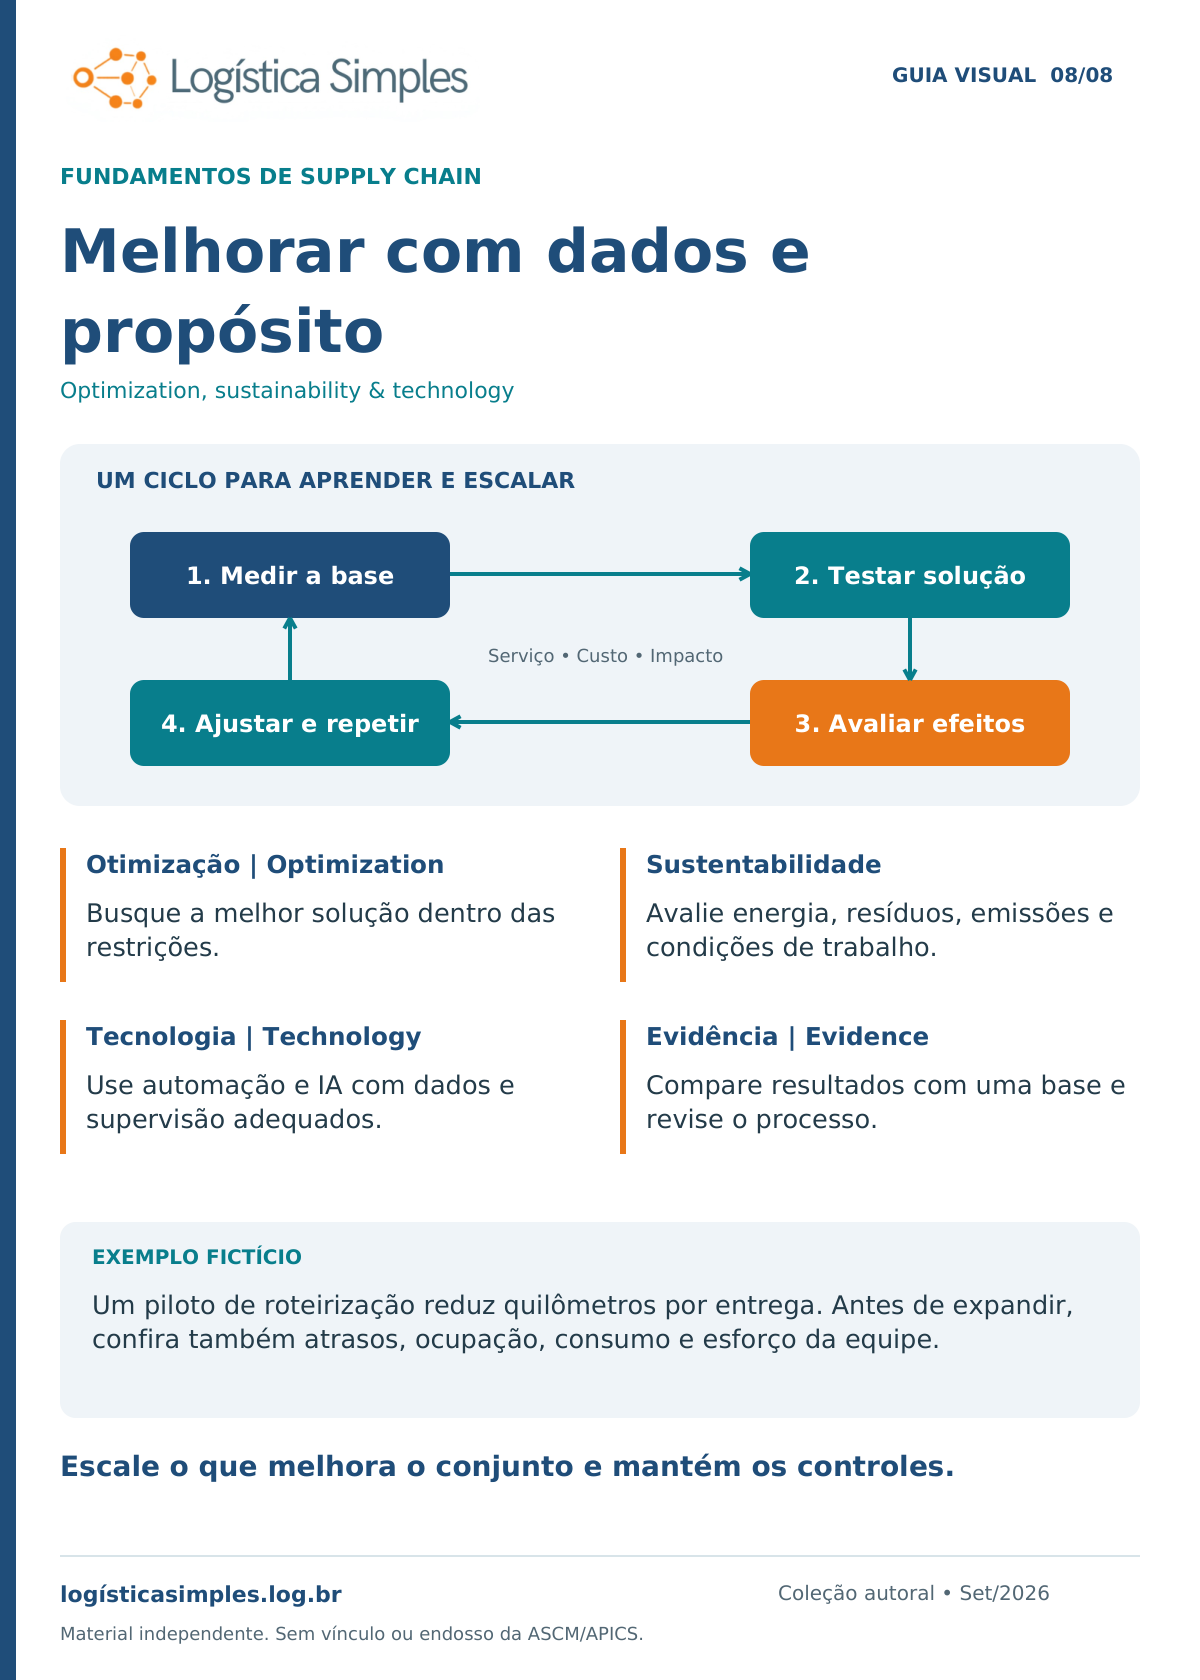
Infographic 8: Improve with data and purpose. Diagram, four concepts and a fictional example. Full translated text below.
Read the text version

Optimization, sustainability & technology

Optimisation
Find the best solution within constraints.
Sustainability
Assess energy, waste, emissions and working conditions.
Technology
Use automation and AI with suitable data and oversight.
Evidence
Compare results with a baseline and review the process.

Fictional example: A routing pilot reduces kilometres per delivery. Before expanding, also check delays, load utilisation, consumption and team effort.

Scale what improves the whole while maintaining controls.

About this collection

Text, diagrams and examples created for Logística Simples. No course slides, exam questions, figures or logos were reproduced. Numbers are educational and do not represent company results.

Reference for topic correspondence only: public structure of the eight modules — ASCM Akron, accessed on 12 September 2026.

Share complete pieces, retaining the Logística Simples attribution. For promotion, link to this page: resources are available without registration.

← Back to all resources

Back to top